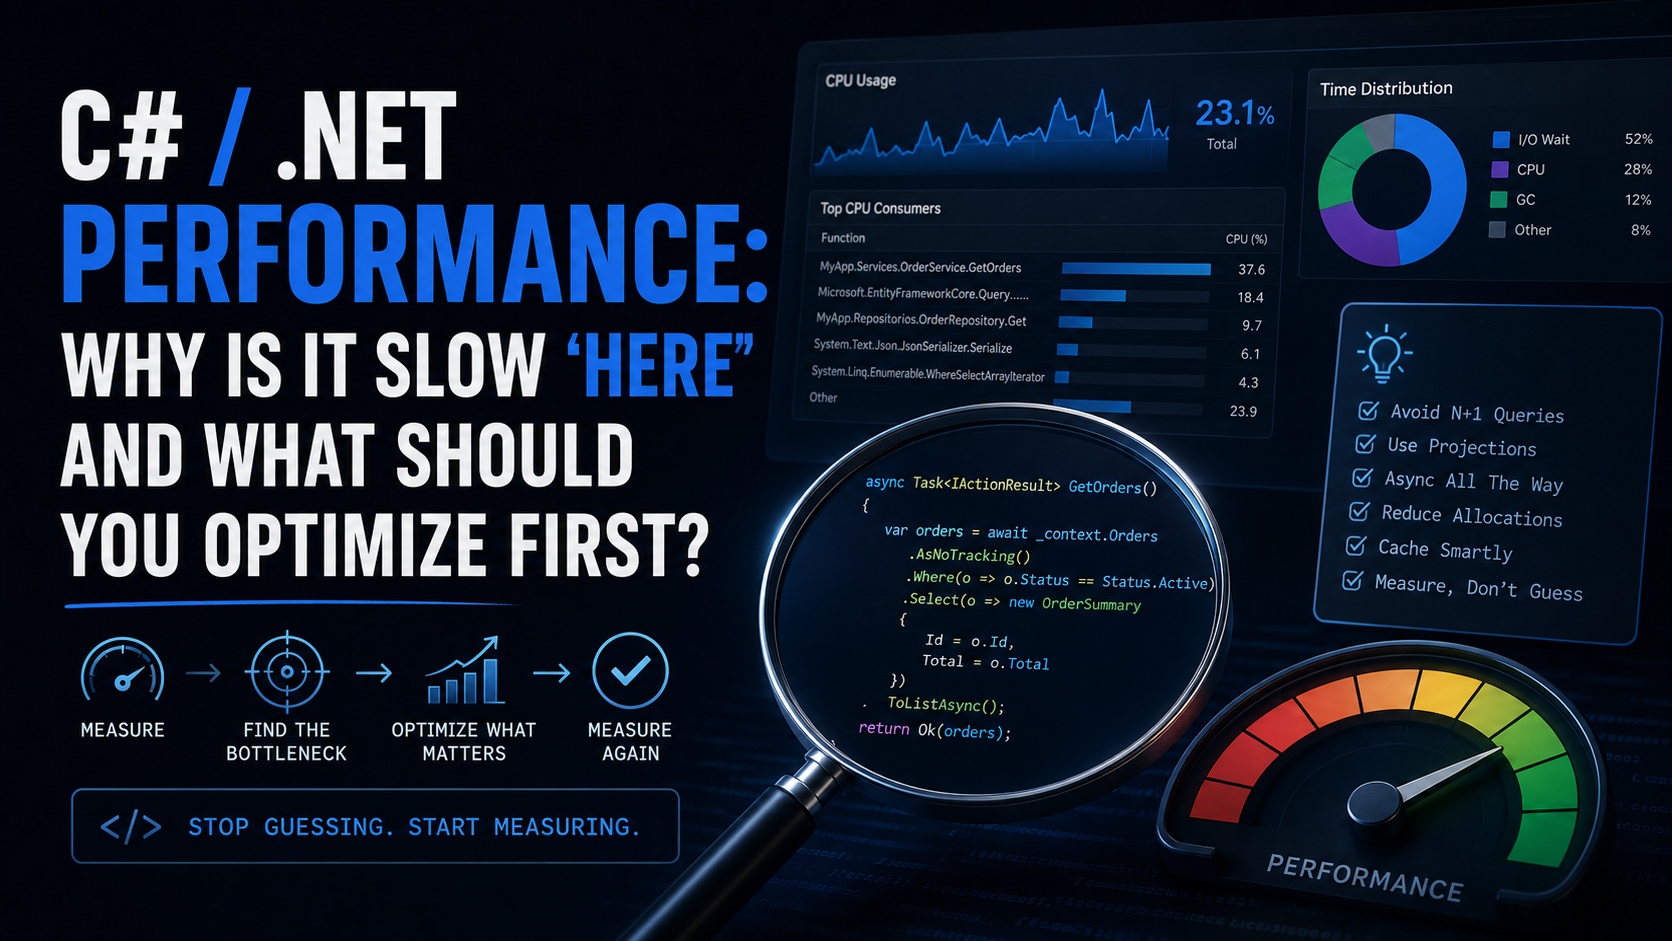
You open a profiler, squint at the code, and ask: “Why is this slow?” Before you even finish the thought, someone — or an AI assistant — suggests switching from List<T> to Span<T>, or inlining a method, or using stackalloc. These are micro-optimizations. They rarely matter until you’ve already found the real bottleneck.
After 20+ years of building and operating .NET systems, here’s what I’ve learned: the slowest code is almost never where you think it is, and the fix is almost never a clever trick. It’s measurement, then architecture, then targeted optimization — in that order. -w
Stop Guessing. Measure.
The single most important performance habit is this: never optimize without a measurement telling you where to look.
Tools that earn their place in your workflow:
- BenchmarkDotNet — microbenchmark specific methods when you already know the hot path.
- dotnet-counters / dotnet-trace — lightweight runtime diagnostics without redeploying.
- Visual Studio Profiler or JetBrains dotTrace — CPU and memory profiling with call trees.
- Application Insights / OpenTelemetry — production-level latency and dependency tracking.
- PerfView — deep GC and allocation analysis for server workloads.
If you haven’t measured, you’re decorating. Not optimizing.
The Real Performance Killers in .NET Applications
Here’s my prioritized list of where performance problems actually live in production .NET apps — ordered by how often they matter and how much impact fixing them delivers.
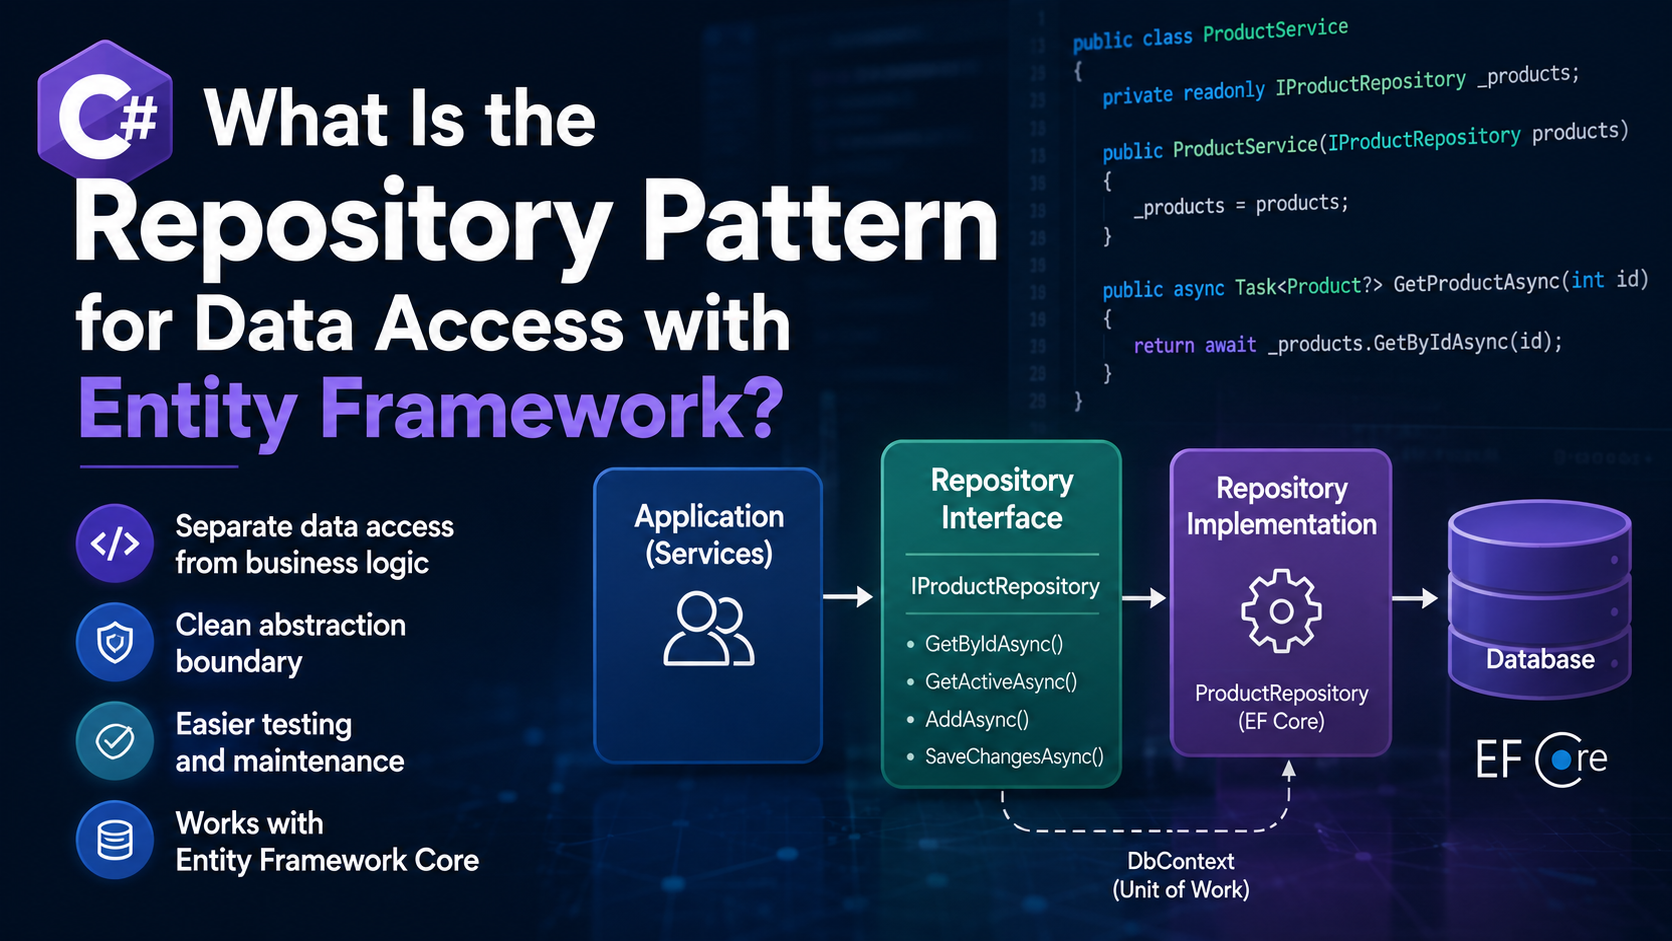
1. Database and EF Core Queries
This is the number one offender in almost every .NET web application I’ve touched.
Common problems:
- N+1 queries from lazy loading or missing
.Include()calls. - Loading entire tables when you need one column.
- Missing indexes on frequently-filtered columns.
- Tracking entities you never intend to update.
What to do:
// Bad: Loads full entities with change tracking
var orders = await _context.Orders.ToListAsync();

// Better: Project only what you need, no tracking overhead
var orderSummaries = await _context.Orders
    .AsNoTracking()
    .Where(o => o.Status == OrderStatus.Active)
    .Select(o => new OrderSummary { Id = o.Id, Total = o.Total })
    .ToListAsync();
Use .AsNoTracking() for read-only queries. Use projections with .Select() instead of pulling full entity graphs. Log your SQL — EF Core’s EnableSensitiveDataLogging in development will show you exactly what’s hitting the database.
2. I/O Latency and Missing Async
Synchronous I/O on a web request thread is still one of the fastest ways to tank throughput under load. Every blocking call that waits on a network response is a thread that can’t serve another request.
Rules:
- Use
async/awaitall the way down. One.Resultor.Wait()in the call chain can deadlock or starve the thread pool. - Batch I/O where possible. Five sequential HTTP calls should probably be
Task.WhenAll. - Measure external dependency latency separately from your code’s execution time.
// Bad: Sequential calls when they're independent
var user = await _userService.GetUserAsync(id);
var orders = await _orderService.GetOrdersAsync(id);
var prefs = await _prefService.GetPreferencesAsync(id);

// Better: Parallel when there's no dependency
var userTask = _userService.GetUserAsync(id);
var ordersTask = _orderService.GetOrdersAsync(id);
var prefsTask = _prefService.GetPreferencesAsync(id);

await Task.WhenAll(userTask, ordersTask, prefsTask);
3. Allocations and GC Pressure
The garbage collector in .NET is excellent — until you make it work too hard. High allocation rates on hot paths cause frequent Gen 0 collections and, worse, Gen 2 collections that pause your application.
Where allocations hide:
- LINQ chains that create intermediate arrays or iterators in tight loops.
- String concatenation in loops (use
StringBuilderorstring.Create). - Boxing value types into
object(common with older APIs or reflection). - Closures that capture variables and allocate a hidden class.
What to do:
- Use
Span<T>andMemory<T>for slicing without allocating. - Pool objects with
ArrayPool<T>orObjectPool<T>on hot paths. - Prefer
structrecords for short-lived data transfer on hot paths — but only when measurement shows allocation pressure.
4. Serialization Overhead
JSON serialization shows up in nearly every API. System.Text.Json is fast by default, but you can still lose time if you’re serializing more data than the consumer needs or using reflection-based serialization in high-throughput paths.
Tips:
- Use source generators for
System.Text.Jsonin high-throughput scenarios. - Don’t serialize entire entity graphs — project to DTOs first.
- If you’re still on
Newtonsoft.Json, benchmark whether migrating toSystem.Text.Jsonmoves the needle for your workload.
// Source-generated serialization context for AOT and throughput
[JsonSerializable(typeof(OrderSummary))]
internal partial class AppJsonContext : JsonSerializerContext { }
5. Caching — or the Lack of It
The fastest code is code that doesn’t run. If you’re computing or fetching the same result repeatedly, cache it.
Layered caching strategy:
- In-memory (
IMemoryCache) for hot, small data. - Distributed (Redis, SQL-based) for data shared across instances.
- HTTP response caching / output caching for entire endpoint responses.
Gotchas:
- Cache invalidation is the hard part. Start with short TTLs and measure hit rates before adding complexity.
- Don’t cache mutable state without a clear invalidation trigger.
6. Lock Contention and Thread Starvation
If you’re using lock statements or SemaphoreSlim in hot paths under high concurrency, contention will show up as threads waiting instead of working.
What to do:
- Prefer
ConcurrentDictionary<TKey, TValue>overDictionary+lock. - Use
Channel<T>for producer/consumer patterns instead of shared lists with locks. - Reduce the scope of locks to the smallest possible critical section.
- If you see
ThreadPoolstarvation in diagnostics, look for sync-over-async patterns first.
7. Startup Time
Cold start matters for serverless, containers, and developer inner-loop speed. .NET 8+ has made strides here, but you can still regress.
Common causes of slow startup:
- Excessive DI registrations that trigger assembly scanning.
- Heavy initialization in
Program.csor constructors that block. - Loading large configuration files synchronously.
What helps:
- Use Native AOT or ReadyToRun compilation where startup latency is critical.
- Defer expensive initialization with
Lazy<T>or background services. - Profile startup specifically — it’s a different beast from steady-state performance.
The Optimization Decision Framework
When you’ve measured and identified a bottleneck, ask these questions in order:
- Can I avoid the work entirely? (Caching, short-circuiting, removing unnecessary computation)
- Can I do less work? (Projections, filtering earlier, smaller payloads)
- Can I do the work in parallel? (
Task.WhenAll, partitioning, pipeline patterns) - Can I do the work more efficiently? (Better algorithms, pooling, fewer allocations)
- Can I do the work later? (Background processing, queues, eventual consistency)
Only at step 4 are you in “micro-optimization” territory. Most production wins come from steps 1–3.
Why AI Gets This Wrong
AI coding assistants are excellent at suggesting locally optimal code transformations. They’ll swap a foreach for a Span<T> slice, recommend stackalloc, or suggest ValueTask over Task. These are valid techniques — in the right context.
But AI doesn’t know:
- What your production traffic patterns look like.
- Which endpoint is actually slow.
- Whether your bottleneck is CPU-bound or I/O-bound.
- That your “slow API” is really just waiting 800ms on a downstream service.
Use AI to implement optimizations after you’ve identified the target through measurement. Don’t let it choose where to optimize.
Conclusion
Performance work in .NET isn’t about knowing the cleverest trick. It’s about discipline:
- Measure to find the real bottleneck.
- Understand whether it’s CPU, memory, I/O, or contention.
- Fix the highest-impact item first.
- Measure again to confirm the fix worked.
The developers who consistently ship fast software aren’t the ones who memorize every Span<T> API. They’re the ones who refuse to guess.